BI Analytics
Create a reliable, easy access analytical source to elevate your decision-making process
Eliminate assumptions and be confident in your decisions
1
Quickly identify current issues at the location & find best-fitted solutions
2
Identify level of potential for the Point of Sale
3
Receive extensive reports about a product, category, brand, store segment or retailer
4
Monitor any metric dynamic in comparison with the previous periods


- Identify OSA metrics execution by store, retailer, category, product or product segment
- Identify which retailer contributes the most to overall OSA
- View OSA progression ranges by location
- Identify store visits without assortment matrixes
- Determine average share of shelf for the category/brand/product/store
- Identify in which category brands holds a maximum or minimum share of shelf
- Compare your Share of Shelf with ones of your competitor
- Identify which retailer contibutes the most to overall OOS
- Identify which products are Out of Shelf most frequently
- Identify the reasons for lack of assortment
- Identify users with highest OOS at locations
- visual representaion of the stores that have met the KPI requirements
- comparing the results of metric compliance of all the POS
- Evaluate the potential of the Point of Sale
- calculating the space occupied by a category at location
- comparing the share of category of your product & of your competitor
- calculating the value of category size based on historical data (AVG, median, MAX, Min)
- calculating planned Share of Shelf value
- displaying store visit information on the map by user, store, region
- all the visit details are grouped in tables for a more comprehensive view of the store visits
- "Geo-tag error" metric
- detecting visits done in less than 5 minutes
- detecting POS with 100% Share-of-Shelf
- detecting photos done from the screen-monitor
- identifying users with too many or too little photos during visits
- detecting users violating the rules of taking a picture during the visits
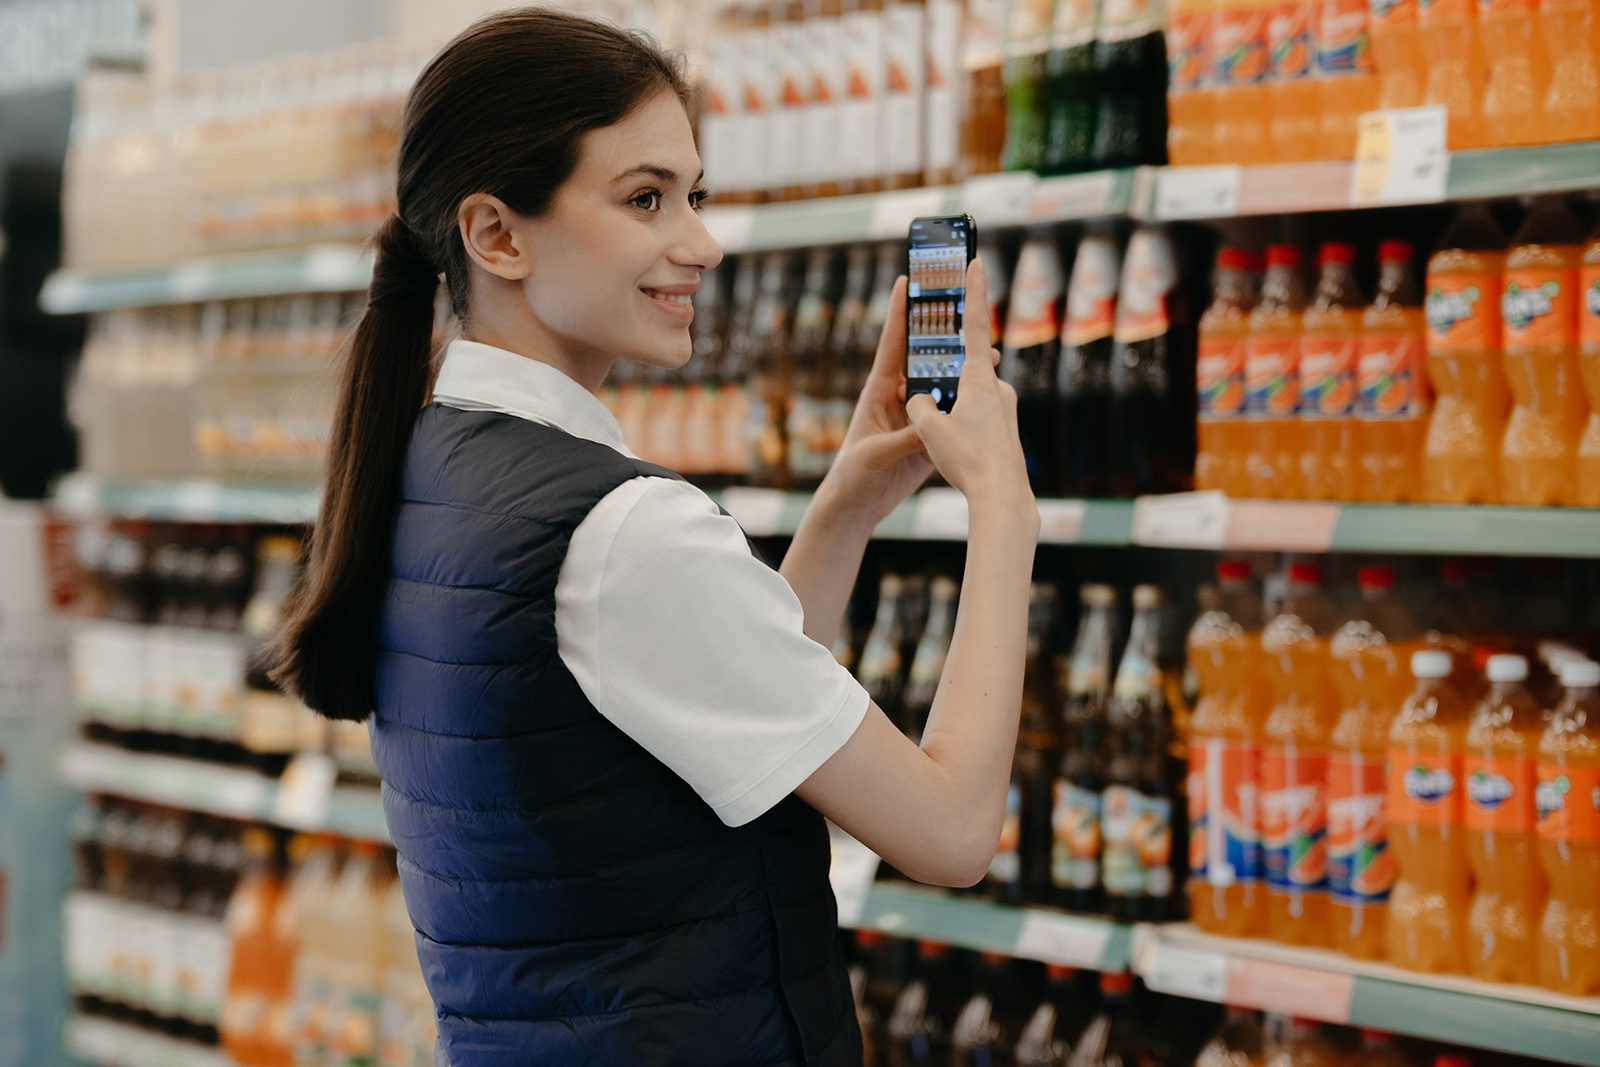
Take a photo of the shelf and receive detailed analytics for every SKU, product category, brand or Point of Sale
- Embedded or Customized dashboards
- Analytical data detailed according to the client needs
- 24/7 access to your data
- Easy to use interface with all your data analytics in one place
- Pre-installed Data visualization tools
- Seamless data import process


at the location
Identify problem retailers and outlets with low OSA, OOS, SOS

Quickly identify locations, retilers with lowest metrics, define the problem and take corrective actions

at the location
Identify problem retailers and outlets with low OSA, OOS, SOS

Quickly identify locations, retilers with lowest metrics, define the problem and take corrective actions

Identify the reasons for assortment absence (e. g. virtual stock-out, blocked shipments from retail outlets, insufficient ordering, etc.)

Get the facts on breaches of agreements with retailers (absence of the key assortment in your stores)

Identify the reasons for assortment absence (e. g. virtual stock-out, blocked shipments from retail outlets, insufficient ordering, etc.)

Get the facts on breaches of agreements with retailers (absence of the key assortment in your stores)

