


A set of analytical dashboards customised to your specifications
A set of pre-installed standard dashboards
OSA
SOS
OOS
Perfect Store
Category Size Calculation
Map of Visits
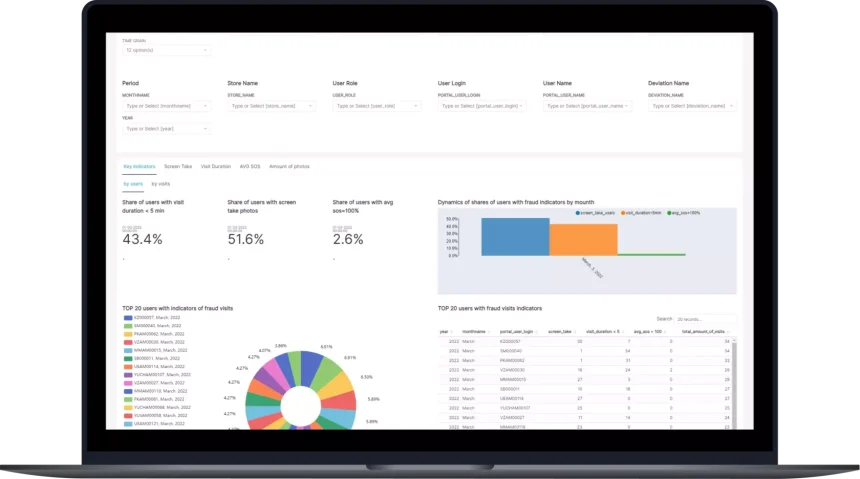
Antifraud & Photo-Shooting guidelines
Does not require additional actions from field-force or management
Take a photo of the shelf and receive detailed analytics for every SKU, product category, brand or Point of Sale


Benefits from solution

Identify problem retailers and outlets with low OSA, OOS, SOS

Quickly identify locations, retilers with lowest metrics, define the problem and take corrective actions

Identify the reasons for assortment absence (e. g. virtual stock-out, blocked shipments from retail outlets, insufficient ordering, etc.)

Get the facts on breaches of agreements with retailers (absence of the key assortment in your stores)
